See everything your
agents do.
Stop what they shouldn't.
The runtime reliability layer for AI agents. Prevent loops, enforce budgets, circuit-break failing tools, monitor MCP health. Instrument once — protection is automatic.
Why LangSight exists
Observability tools watch.
LangSight prevents.
Every platform in the market traces what happened after the fact. Nobody stops loops, enforces budgets, or circuit-breaks failing tools at runtime. That's the gap LangSight fills.
The product
Built for the engineer
who gets paged at 2 AM.
Every page answers a question you'd ask during an incident. No dashboards for dashboards' sake.
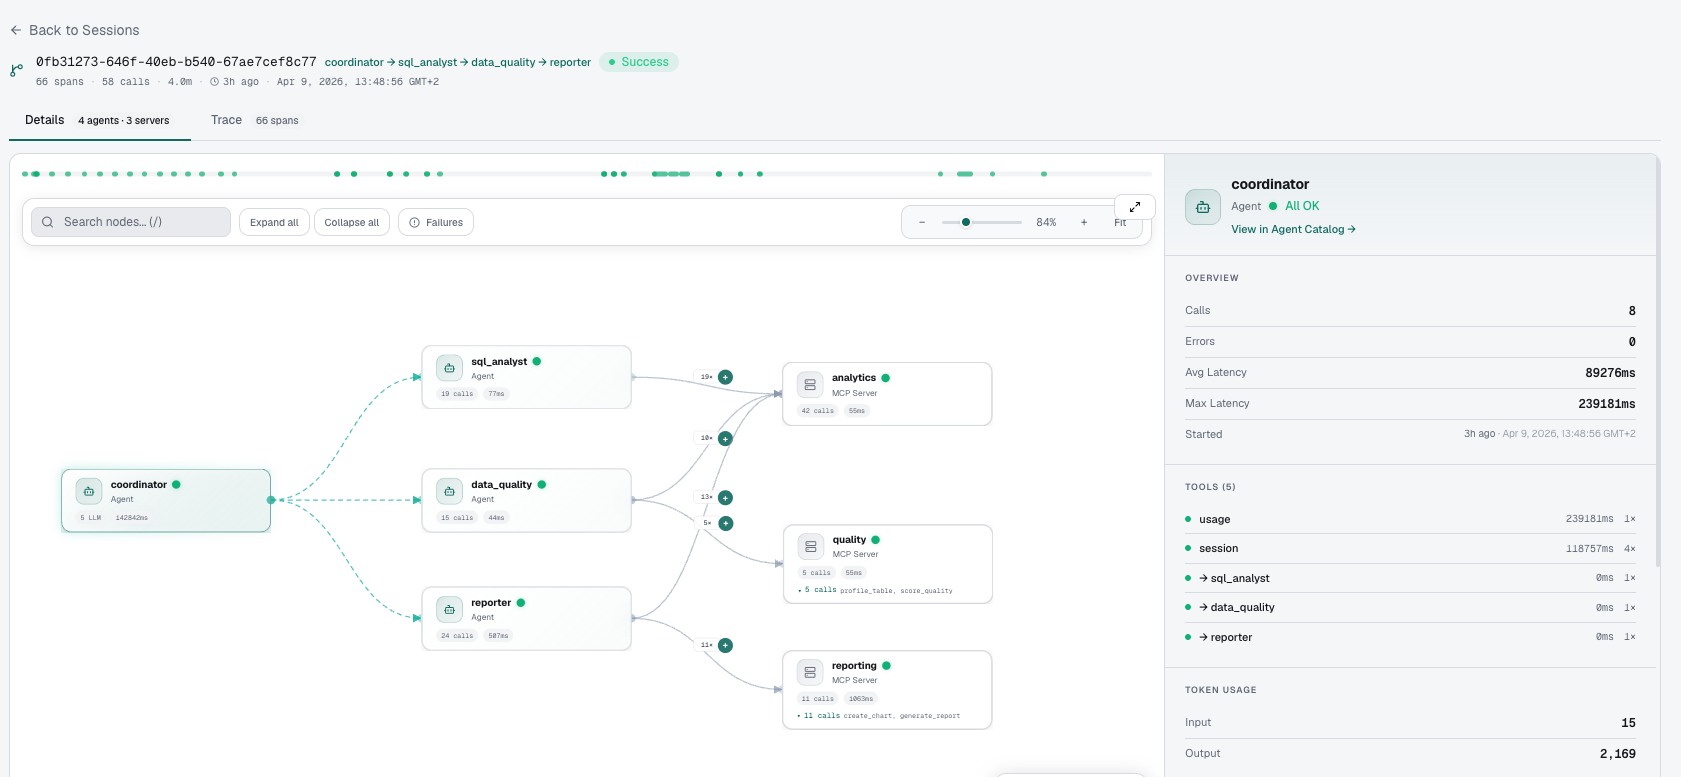
The clearest way to see what your agents did.
A visual DAG of your entire agent session — coordinator → sub-agents → MCP servers — with call counts, latency, and full detail on click. Understand any session in seconds.
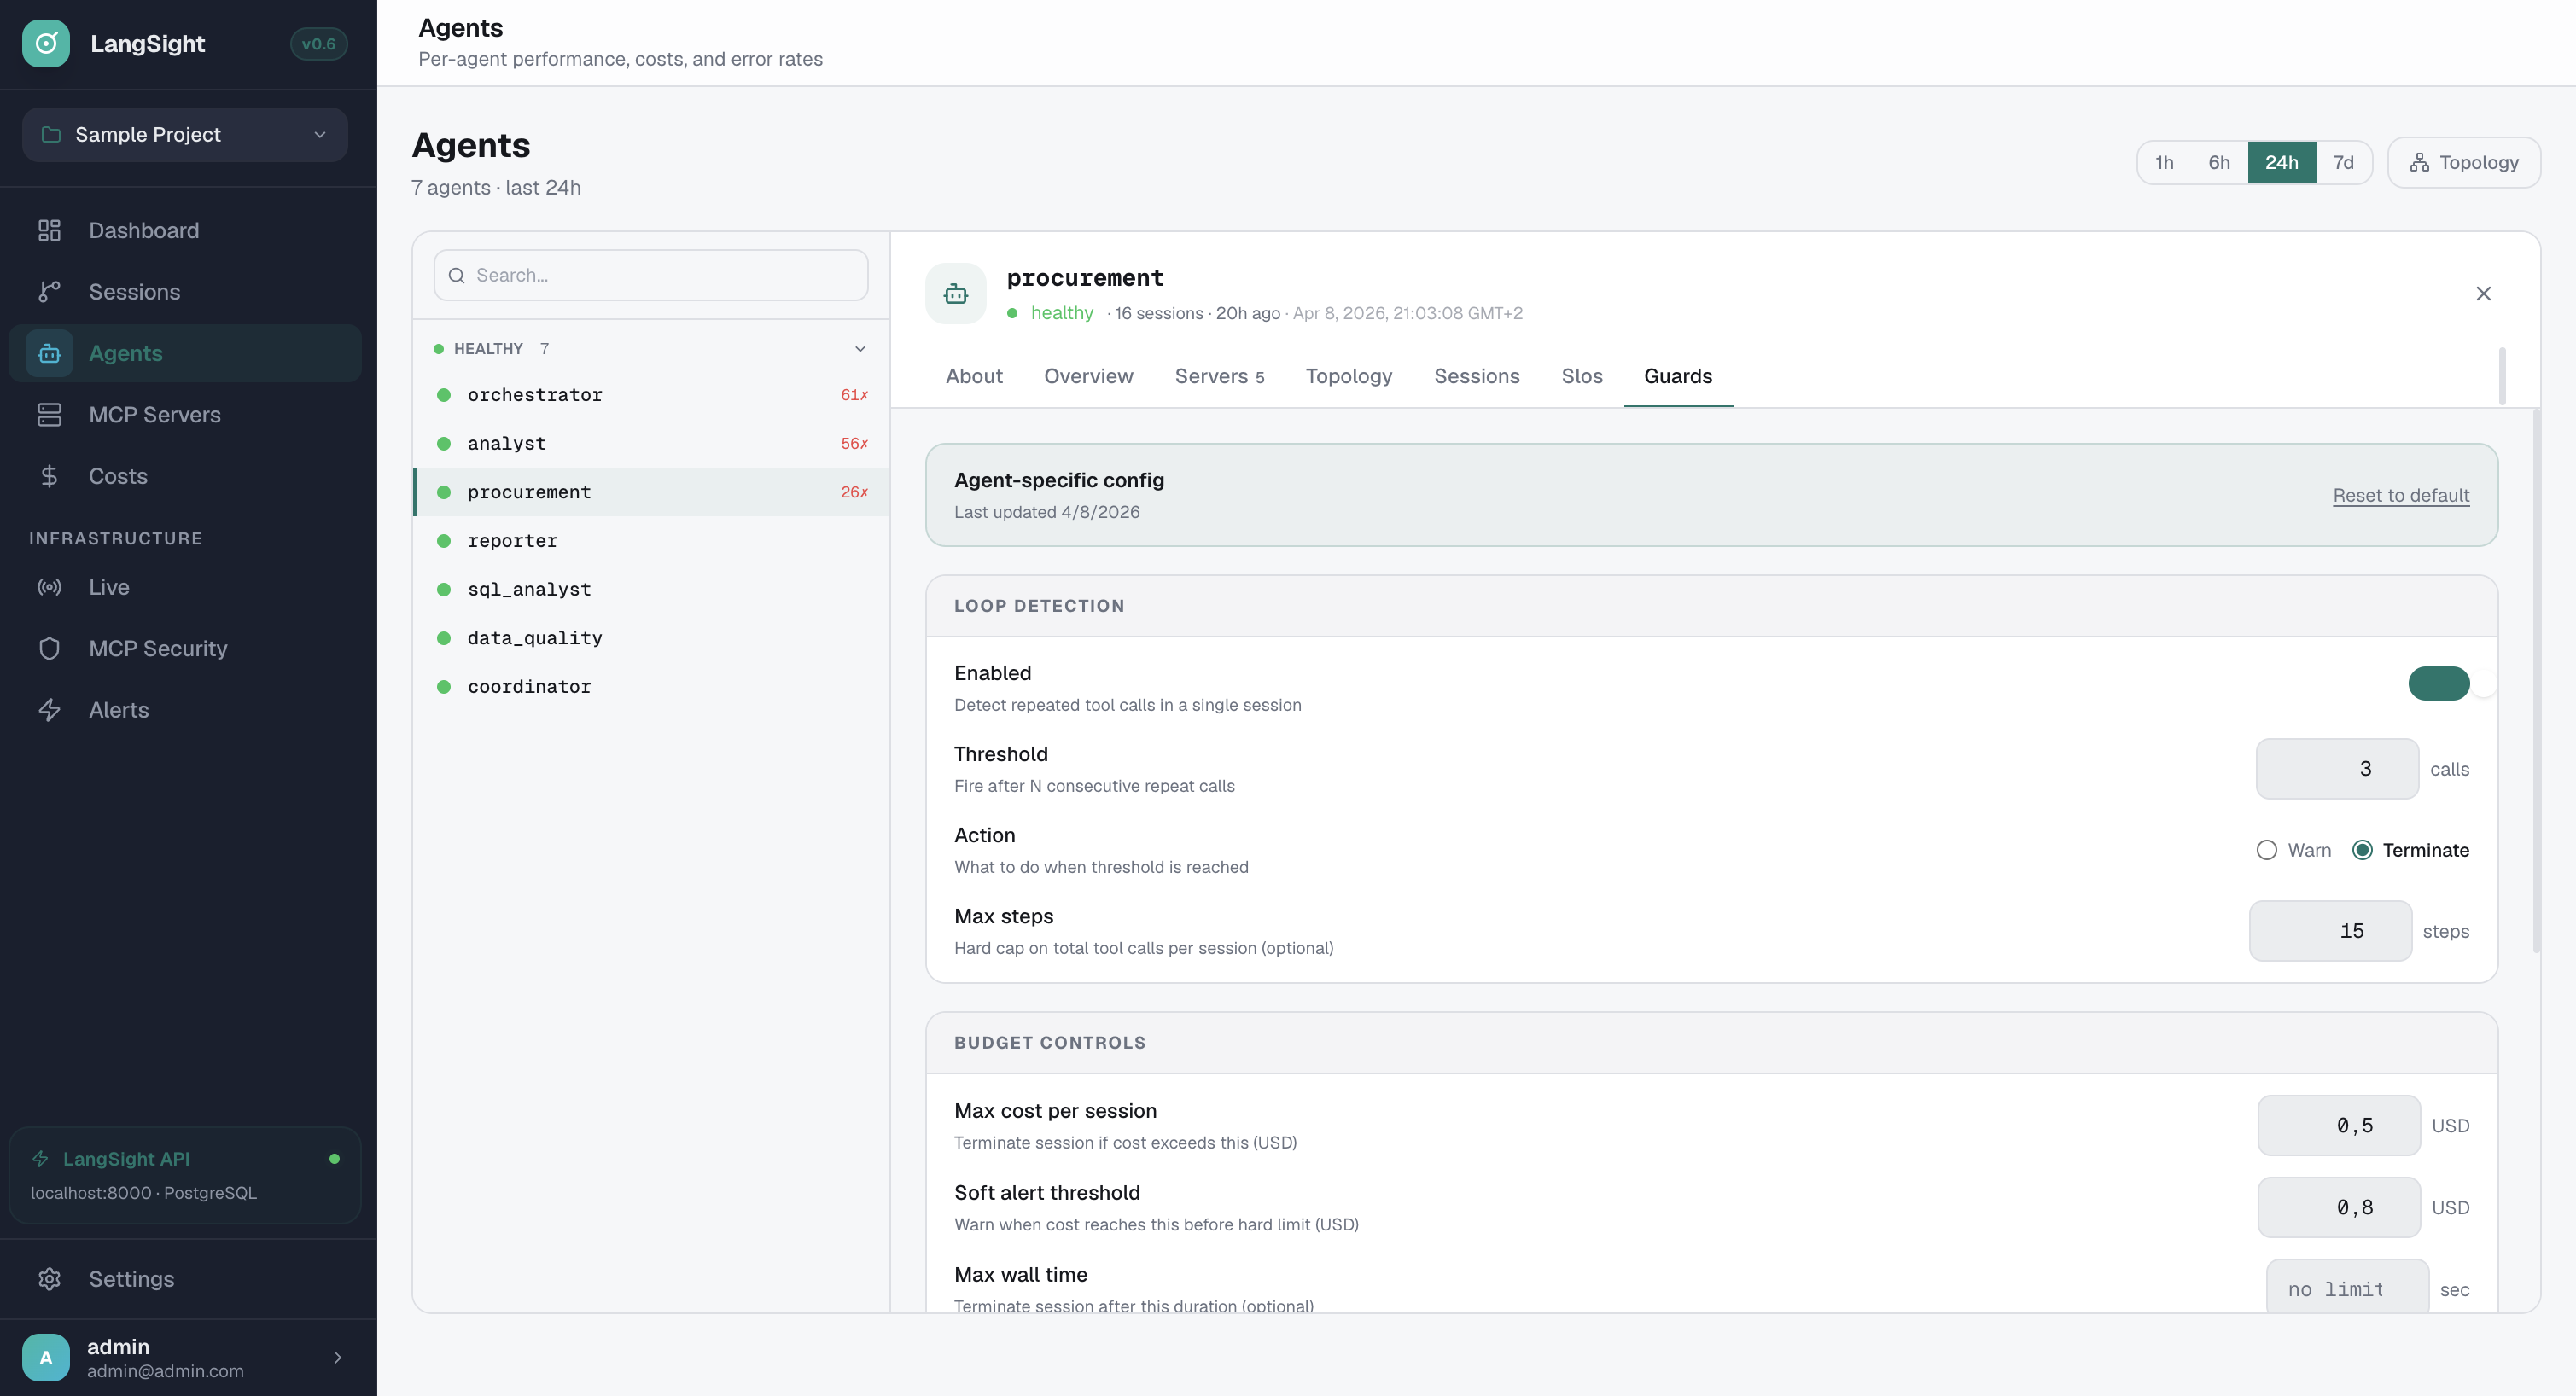
Per-agent guardrails. From the dashboard.
Loop detection, budget limits, max steps — configured per agent without code changes. Set thresholds, choose warn or terminate, control costs in real-time.
- Loop detection: fire after N consecutive repeat calls
- Action: Warn or Terminate — your choice per agent
- Budget controls: max cost per session in USD
- Soft alert threshold + hard kill limit
- Max wall time to prevent runaway sessions
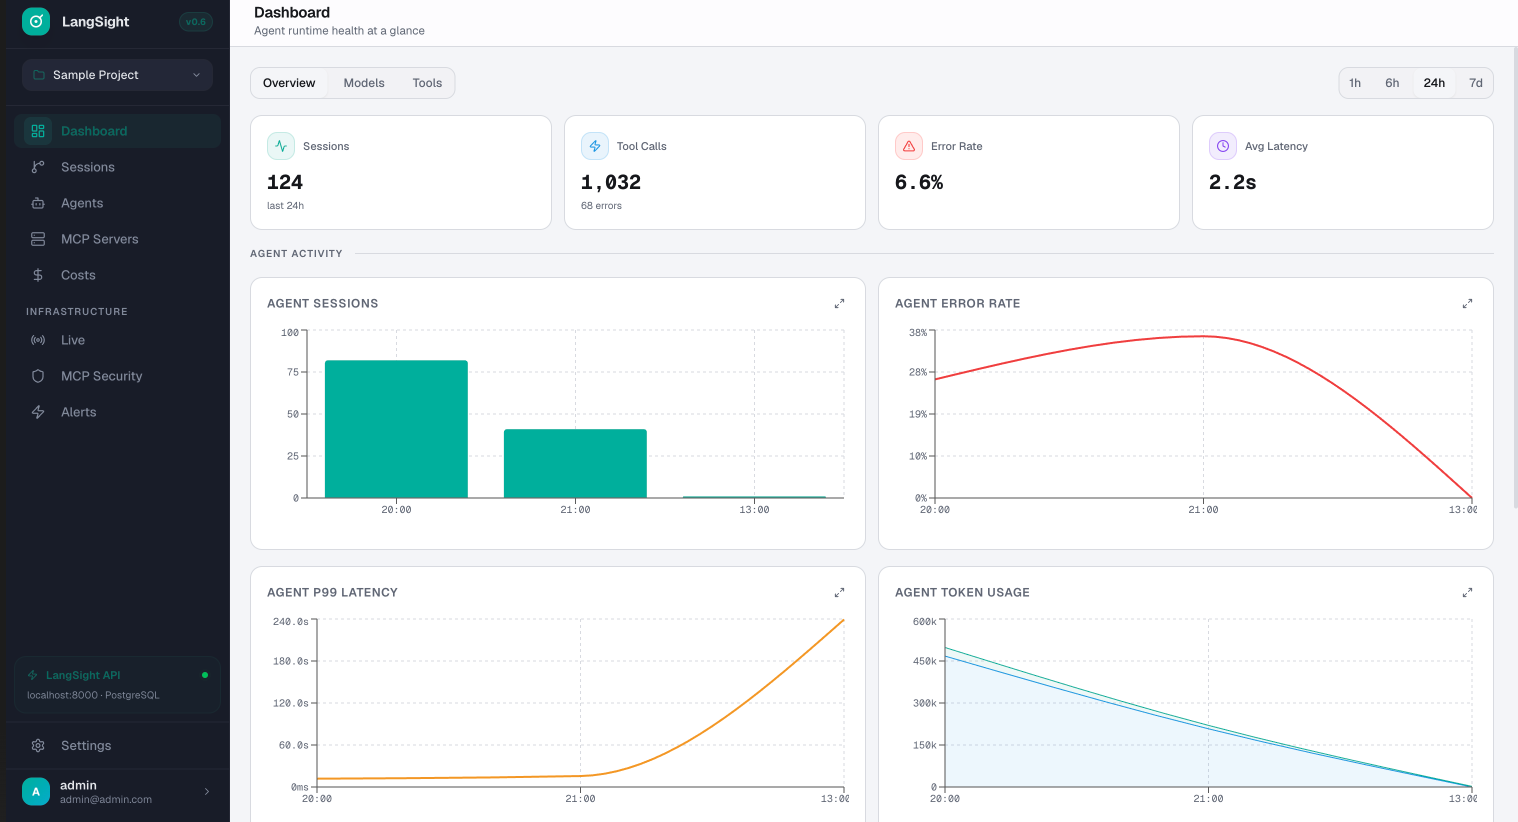
Agent runtime health at a glance.
Sessions, tool calls, error rate, P99 latency, token usage — all in real-time. Overview, Models, and Tools tabs. 1h to 7d time ranges.
- 4 KPI cards: sessions, tool calls, error rate, avg latency
- Agent sessions + error rate trend charts
- P99 latency tracking across all agents
- Token usage breakdown (input, output, cache)
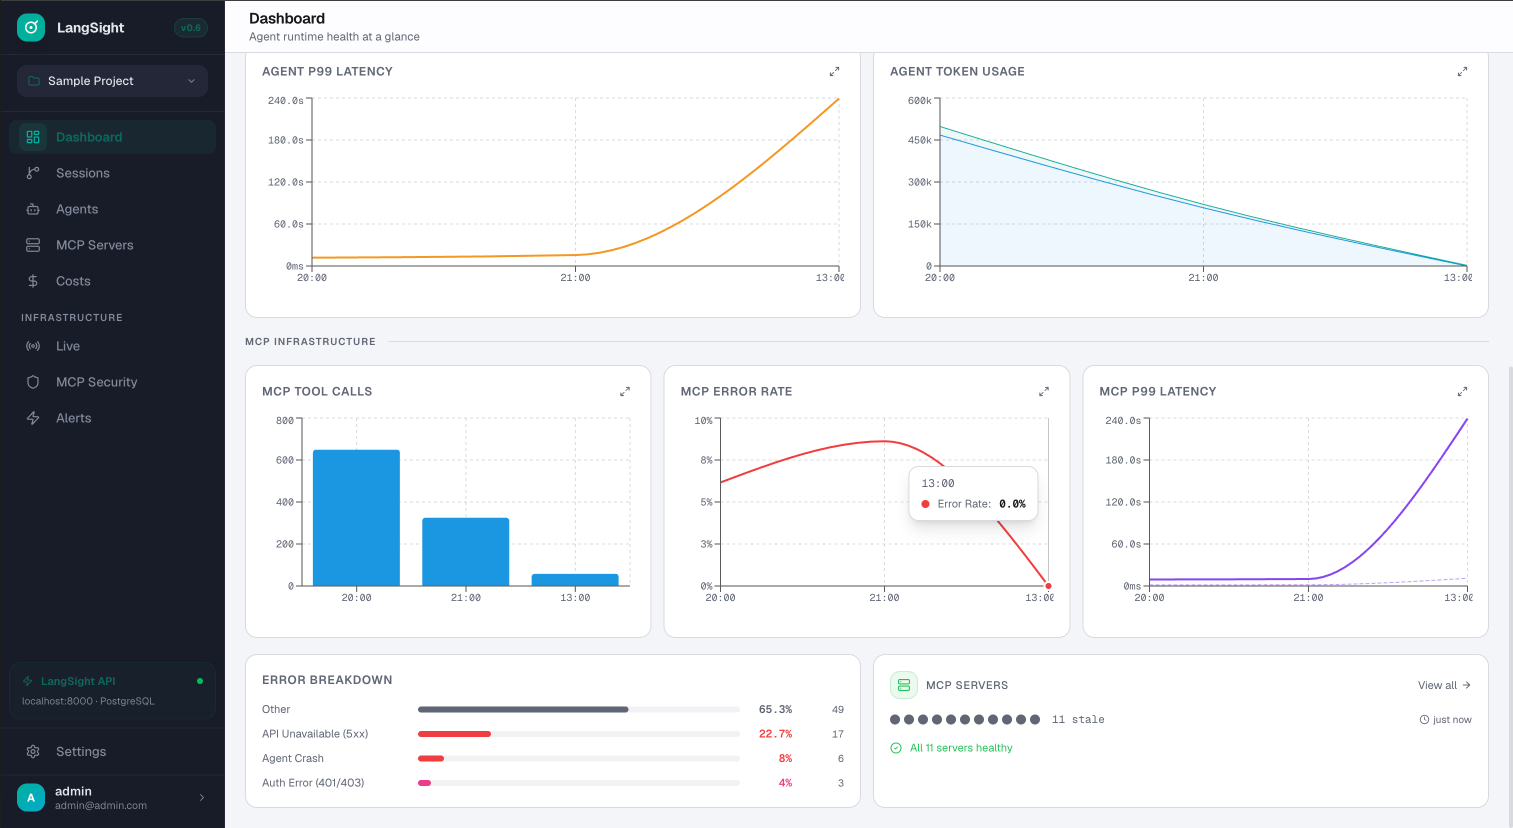
MCP infrastructure monitoring.
Dedicated MCP section: tool call volume, error rates, P99 latency per server. Error breakdown by type. Fleet health at a glance.
- MCP tool calls, error rate, P99 latency per server
- Error breakdown: API unavailable, agent crash, auth errors
- Server fleet health: green dots = all healthy
- Correlate MCP failures with agent errors
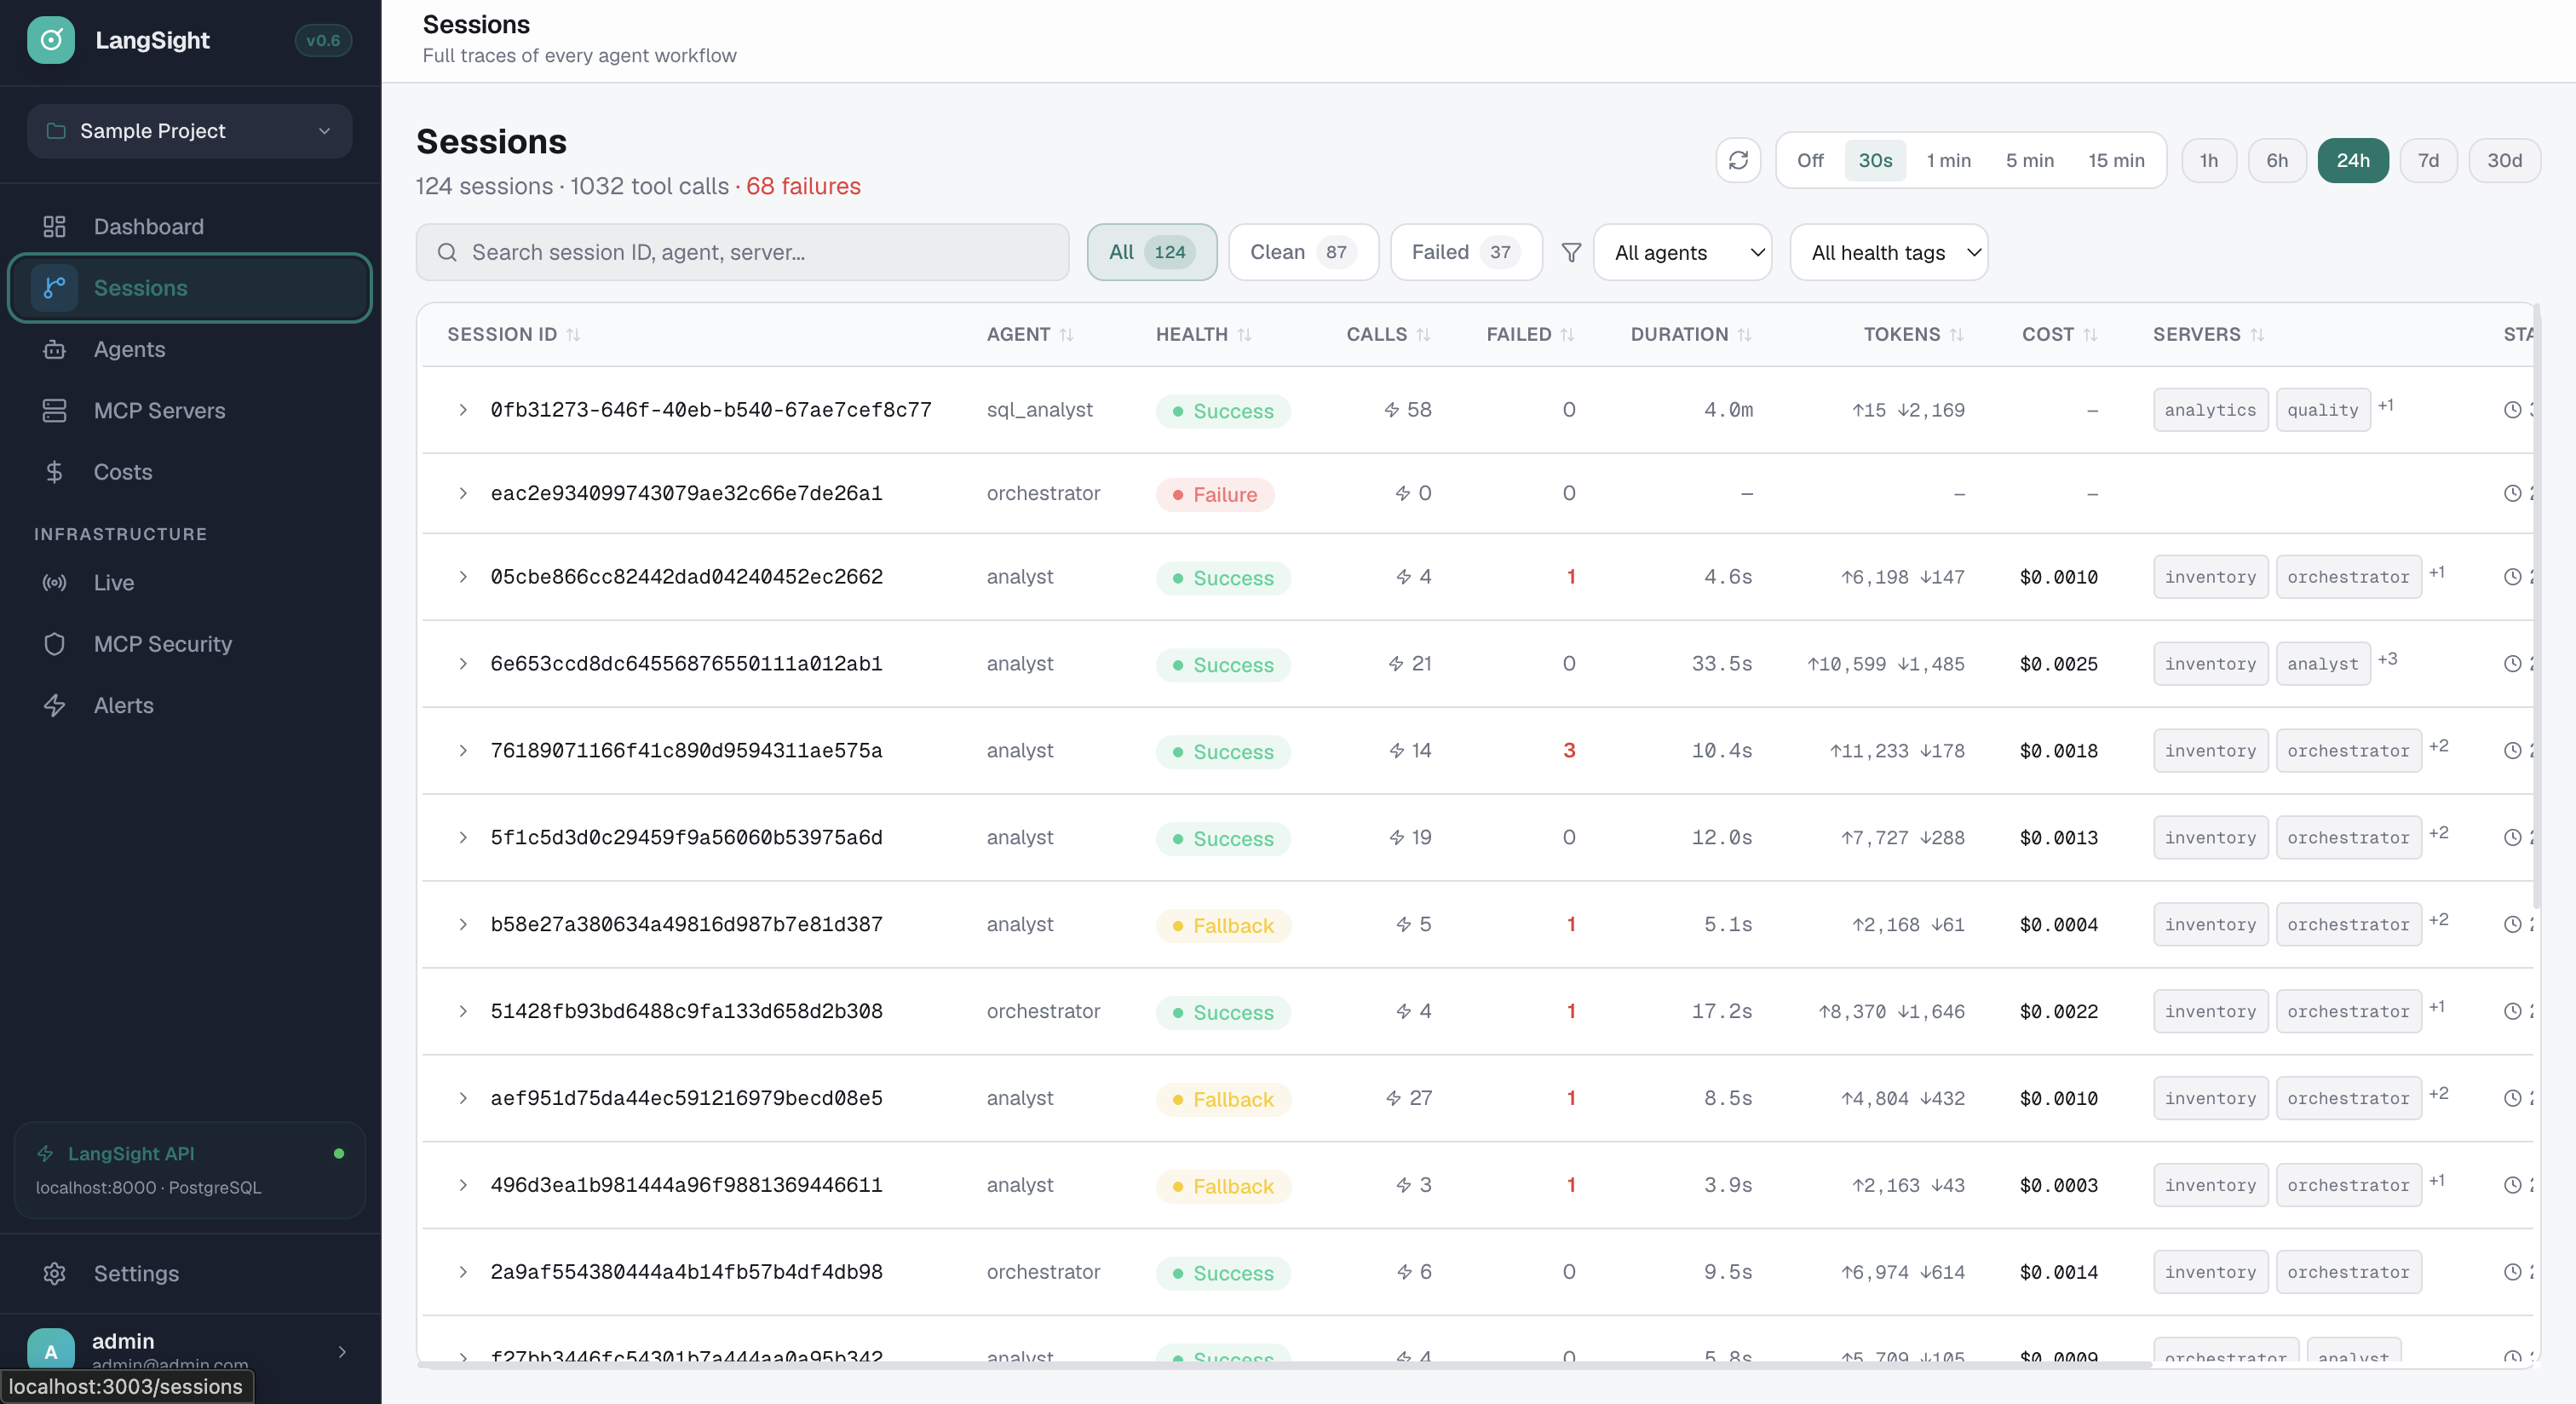
Every session. Filterable. Searchable.
Session list with health tags, agent name, call count, duration, tokens, cost. Filter by status, agent, or health tag. Click to drill into full trace.
- Health tags: success, failure, loop, budget exceeded
- Filter by agent, status, health tag
- Sort by duration, cost, token count
- Click to drill into full session trace + graph
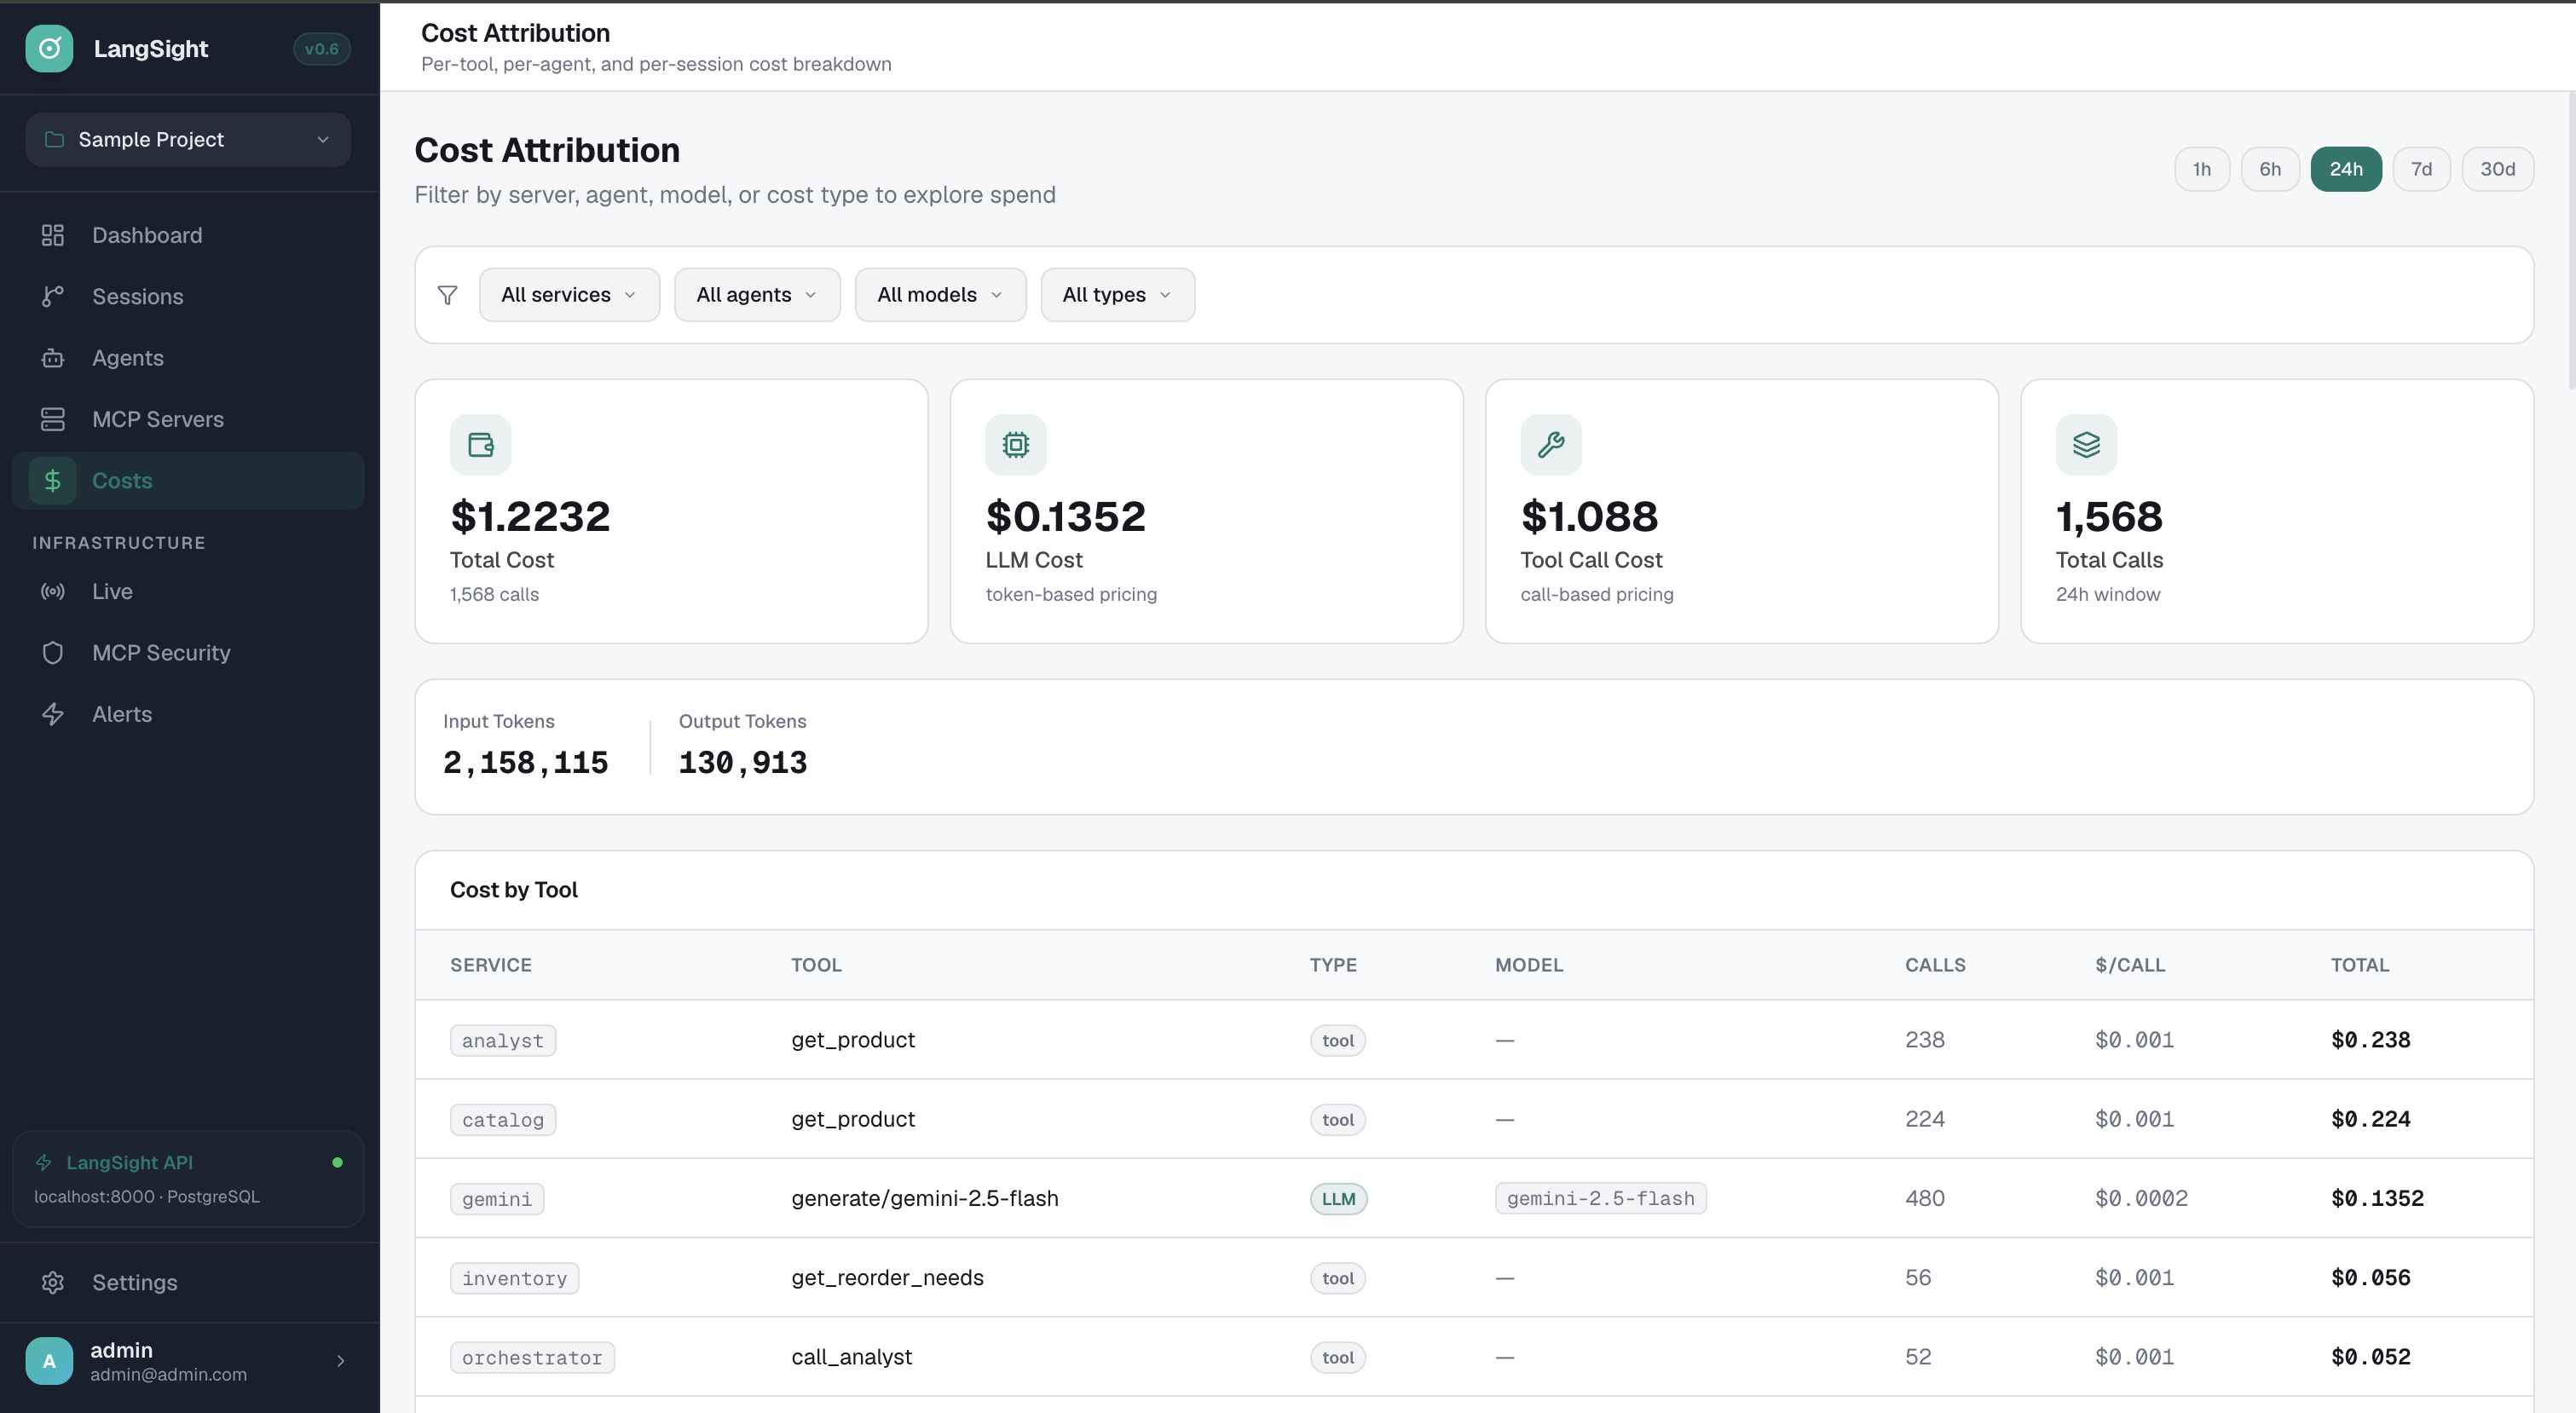
Cost attribution. Per-tool. Per-agent. Per-model.
See exactly where your money goes. Total cost, LLM cost, tool call cost — broken down by service, tool, model, and cost type.
- $1.22 total → $0.13 LLM + $1.09 tool calls
- Cost per call: $0.001 for tools, $0.135 for Gemini
- Filter by service, agent, model, cost type
- 2.1M input tokens, 130K output tokens breakdown
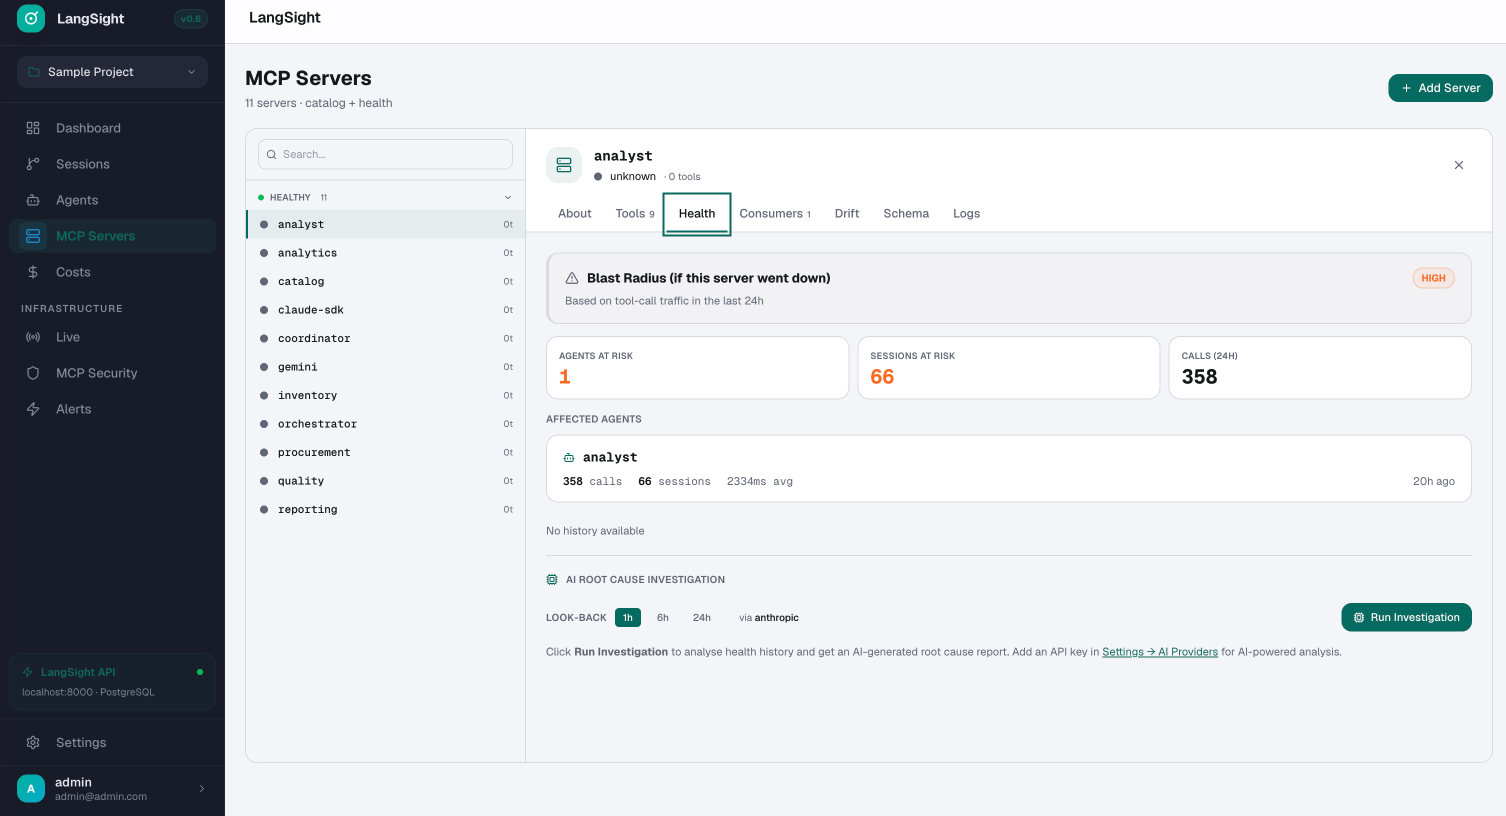
MCP health + blast radius + AI root cause.
Per-server health panel: if this server went down, how many agents and sessions are affected? AI-powered root cause investigation built in.
- Blast radius: agents, sessions, and calls at risk
- Health, Tools, Consumers, Drift, Schema, Logs tabs
- AI root cause investigation (Anthropic, 1h-24h lookback)
- Click "Run Investigation" for automated RCA report
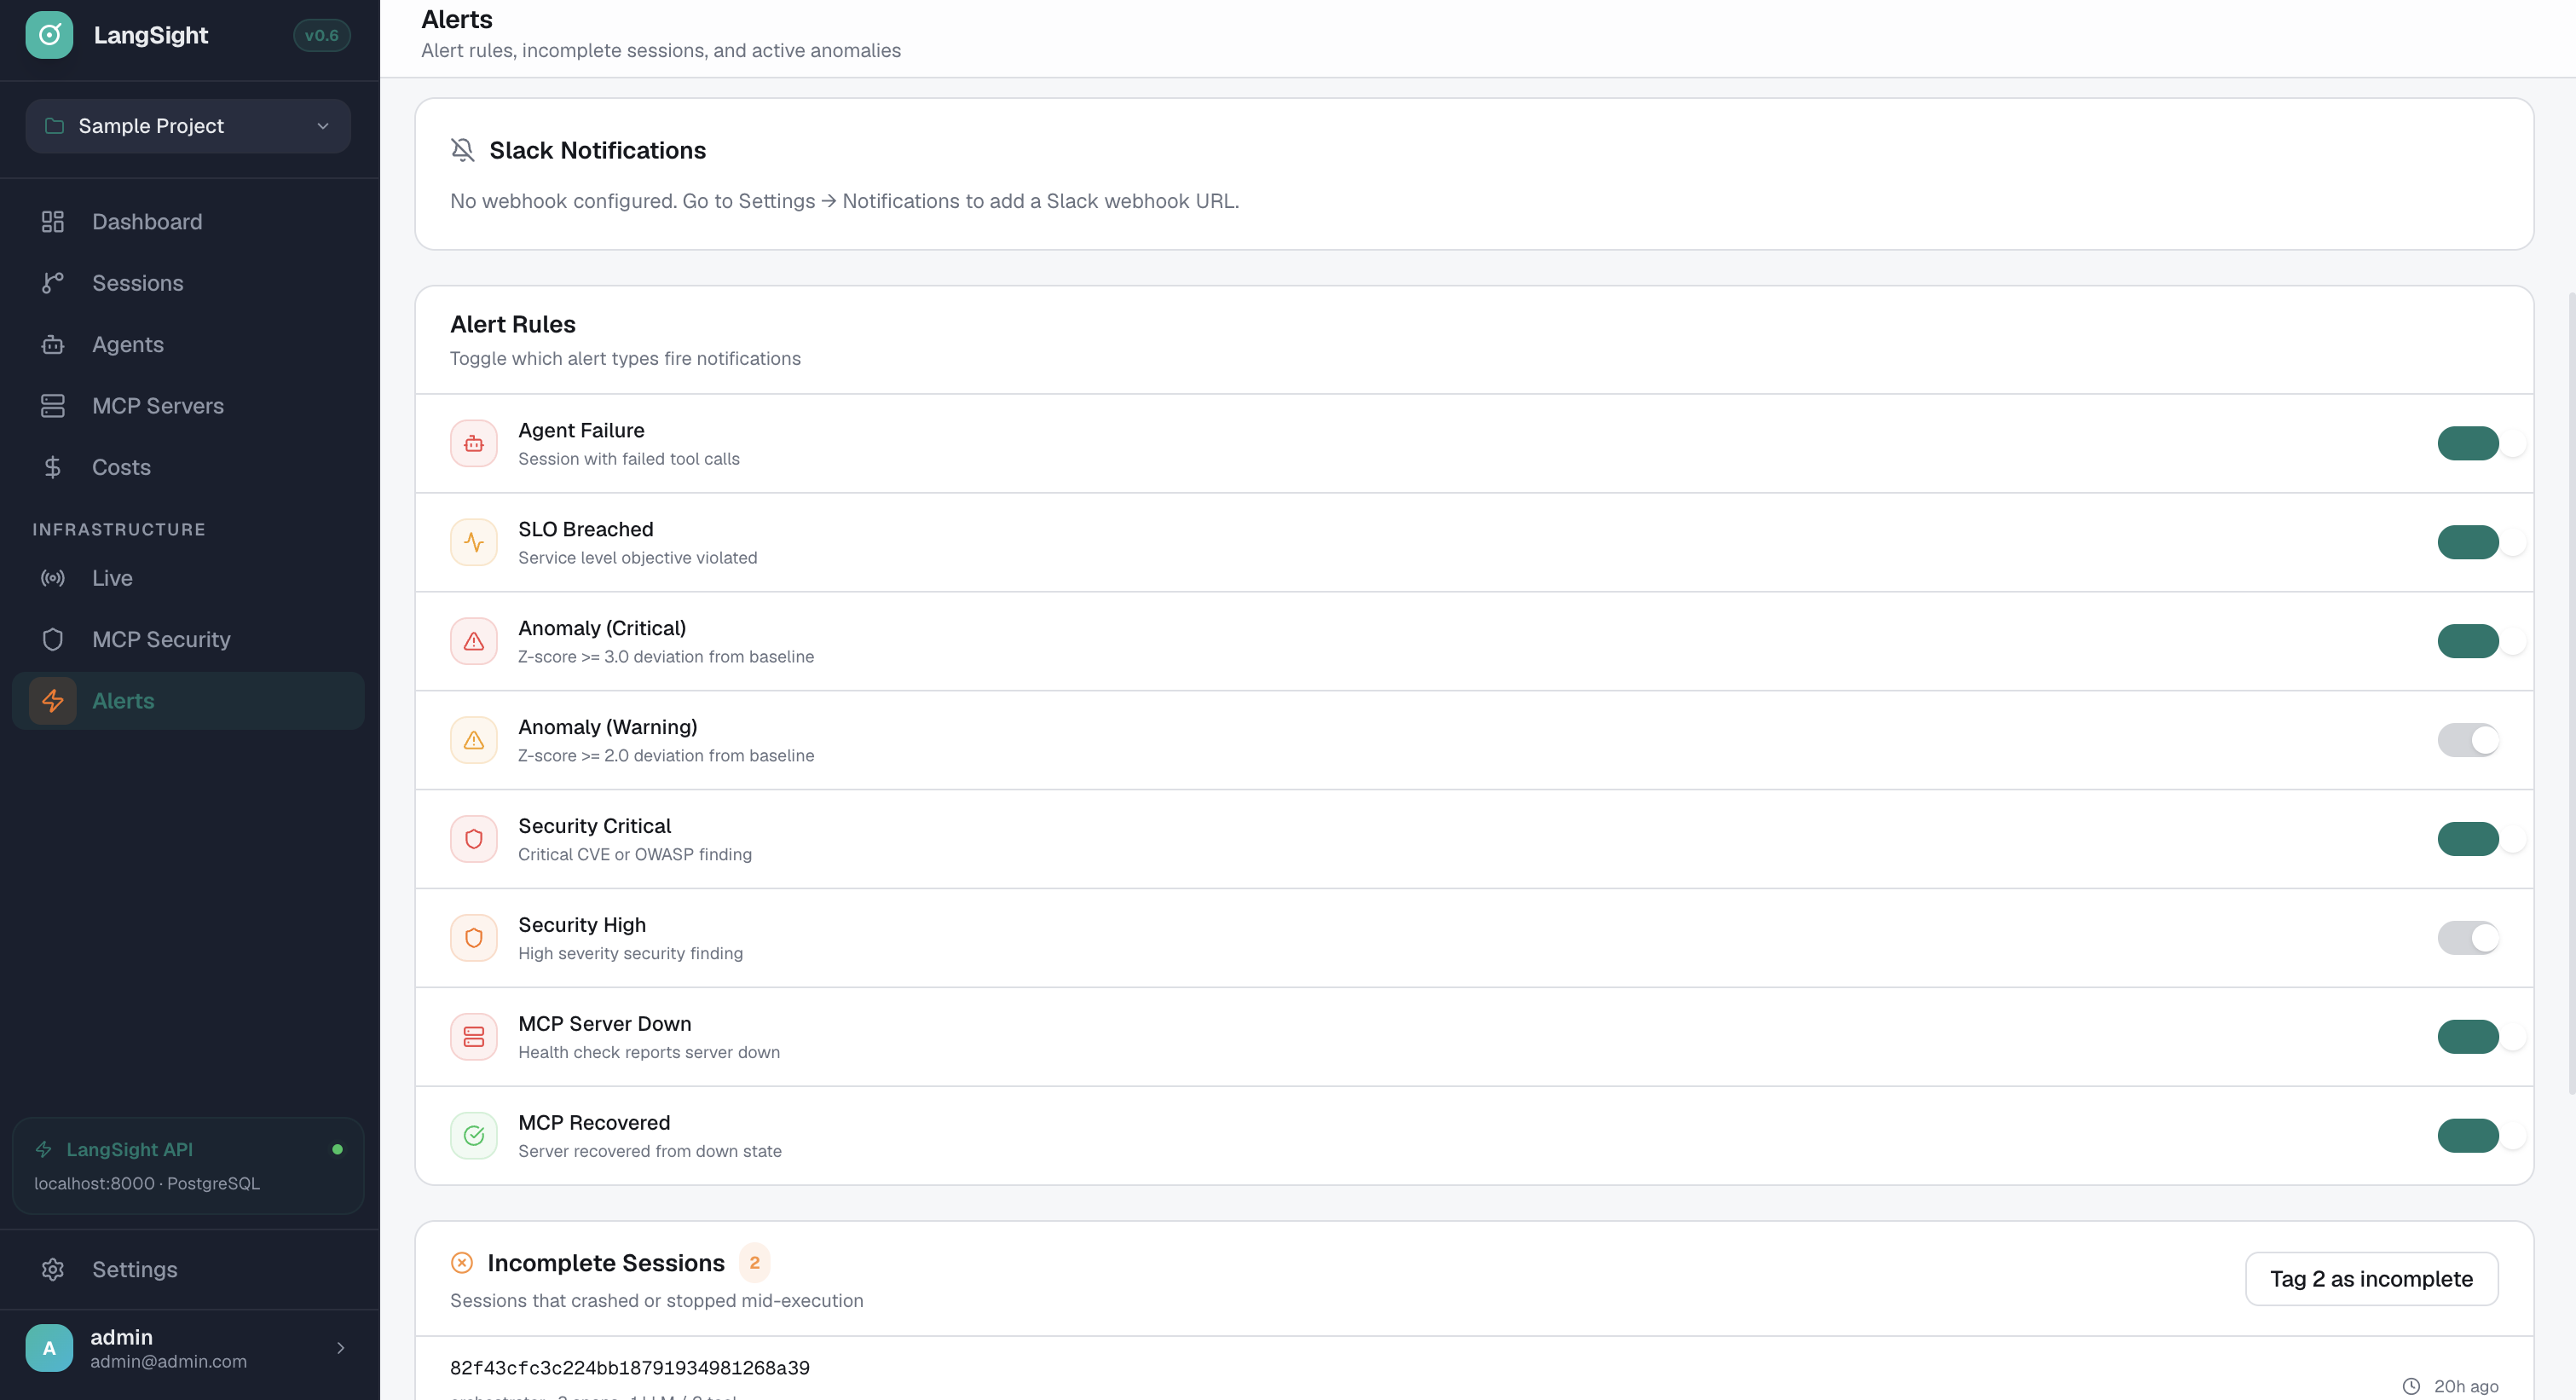
8 alert types. Slack + webhooks.
Agent failure, SLO breached, anomaly (critical + warning), security findings, MCP server down/recovered. Toggle each independently.
- Agent Failure: session with failed tool calls
- SLO Breached: service level objective violated
- Anomaly: z-score >=3 (critical) or >=2 (warning)
- MCP Down/Recovered: server health state changes
- Incomplete session tracking and tagging
Integrations
Drop into any framework.
One line of code. Full tracing, prevention, and cost attribution. Zero-code for Claude Agent SDK and CrewAI.
What LangSight captures
Prevention + detection + monitoring.
Get started
Zero to traced
in 5 minutes.
No account needed. No vendor dependency. Self-hosted on your infra. Apache 2.0 — fork it, modify it, ship it.
Install the SDK
10 seconds
One pip install. No Docker needed for the SDK — it works standalone with any Python agent.
pip install langsight
Add two lines to your agent
30 seconds
auto_patch() instruments Claude Agent SDK, CrewAI, OpenAI, and Gemini automatically. Zero wrappers, zero config.
import langsight

langsight.auto_patch()

# That's it. Every tool call, handoff,
# and LLM interaction is now traced.
# Loop detection + budget enforcement
# are active automatically.

# Your existing agent code — unchanged:
from claude_agent_sdk import query
result = await query(prompt="...", options=options)
Start the dashboard
5 minutes
One script generates secrets, starts Postgres + ClickHouse + API + Dashboard. You're looking at traces before your coffee is ready.
# Clone and start the full stack
git clone https://github.com/LangSight/langsight
cd langsight

# Auto-generates secrets, starts 5 containers,
# seeds demo data
./scripts/quickstart.sh

# Dashboard: http://localhost:3002
# API:       http://localhost:8000
# Docs:      https://docs.langsight.dev